Cost of Living In London 2026: How Much Are Rent, Bills, Food and Transport Costing?
 Published By
Jermaine
Published By
Jermaine
Published:

Table of Contents
The cost of living in London remains one of the biggest financial challenges facing people in the capital in 2026, even as the UK’s headline inflation rate begins to fall.
Housing remains the most significant pressure for many households. Average private rent in London reached £2,302 per month in June 2026, substantially higher than the £1,446 average across England. At the same time, energy costs increased again in July, transport remains a significant regular expense and many locally provided services continue to cost more in London than elsewhere in the UK.
The picture is therefore more complicated than simply looking at the inflation rate. Inflation tells households how quickly prices are changing; it does not show how expensive those prices have already become.
Official analysis from the Greater London Authority suggests this distinction is particularly important in the capital. London “shelf-front” prices covering areas such as food, clothing, household goods, eating out and childcare have risen by around 70% since 2008, compared with roughly 61% across the UK.
So, what does it actually cost to live in London in 2026, and which expenses are putting the most pressure on household budgets?
What Is the Cost of Living in London in 2026?
There is no single official figure showing exactly how much a person needs each month to live in London.
Costs vary significantly depending on factors including:
- whether someone rents, owns a home or lives with family;
- the London borough in which they live;
- whether they live alone or share accommodation;
- how frequently they use public transport;
- whether they have children;
- childcare requirements;
- energy consumption;
- eating and shopping habits; and
- debt, savings and other financial commitments.
However, several official indicators provide a useful picture of current London living costs.
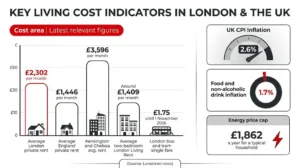
| Cost area | Latest relevant figure |
| Average London private rent | £2,302 per month |
| Average England private rent | £1,446 per month |
| Kensington and Chelsea average rent | £3,596 per month |
| UK CPI inflation | 2.6% |
| Food and non-alcoholic drink inflation | 1.7% |
| Energy price cap | £1,862 a year for a typical household |
| London bus and tram single fare | £1.75 until 1 November 2026 |
| Average two-bedroom London Living Rent | Around £1,409 per month |
These figures do not represent a standard household budget because they measure different things. They do, however, demonstrate why accommodation, utilities and transport can quickly absorb a large part of a London household’s income.
Interactive London budget checker
London Cost of Living Calculator 2026
Enter your monthly take-home income and regular household costs to estimate how much it costs you to live in London. The calculator also compares your rent with the latest official London private-rent average.
Build your London monthly budget
Add the costs that apply to you. The result uses only the amounts you enter; it does not assume that every London household has the same spending pattern.
Your spending breakdown will appear here after you enter some costs.
- The calculator does not estimate tax or gross salary. Enter monthly take-home income if you want to see money remaining after costs.
- All spending figures are monthly and should reflect your own household circumstances.
- The rent comparison uses the London-wide private-rent average and is not a borough-specific valuation.
- Annual costs are calculated as monthly entered costs multiplied by 12.
Important: This is an editorial budgeting tool, not financial advice, a benefits calculator or an affordability assessment. Results depend entirely on the figures entered. The Ofgem price-cap figure is a typical annual illustration based on specified consumption and payment method, not a cap on an individual household's total bill.
Sources and benchmark updates: ONS private rent and house prices, July 2026 , Ofgem energy price cap and TfL bus and tram fare update .
Why Is the Cost of Living So High in London?
London’s higher living costs are driven by several overlapping factors rather than one single expense.
Housing is the clearest difference. Demand for homes in the capital is high, while rental prices are substantially above national averages.
There is also a London premium on some locally provided services.
Research published by GLA Economics in May 2026 found that products sold by large national retailers can have relatively small regional price differences. Two pints of milk, for example, were found to cost roughly the same in London as the wider UK average.
Services influenced by local rents, wages and operating costs can be very different. The same analysis found a pint in a pub cost around a quarter more in London, while childcare showed an even larger London premium.
GLA Economics concluded that London shelf-front prices started separating more noticeably from the UK average around the middle of the 2010s.
By early 2026, cumulative shelf-front price growth since 2008 was around 70% in London compared with approximately 61% nationally.
How Much Is Rent in London in 2026?
Rent is likely to be the largest regular cost for a significant proportion of London households.
According to the latest Office for National Statistics private rental data, the average private rent in London was £2,302 per month in June 2026.
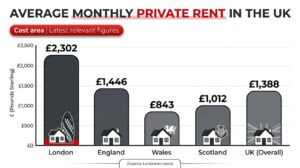
For comparison:
| Area | Average monthly private rent |
| London | £2,302 |
| England | £1,446 |
| Wales | £843 |
| Scotland | £1,012 |
| UK | £1,388 |
London rents increased by 2.2% during the year to June 2026.
Interestingly, that was the lowest annual rental inflation rate of any English region. However, because London rents started from a much higher level, tenants continue to pay significantly more in cash terms.
Which Part of London Has the Highest Rent?
There are major differences between London boroughs.
Kensington and Chelsea recorded an average private rent of £3,596 per month in June 2026, the highest figure among the local areas covered by the ONS data.
This is why using a single London-wide average can sometimes be misleading. The amount someone needs to live in the capital can change dramatically depending on where they choose to rent.
Outer London, sharing a property or renting a smaller home may reduce housing costs, although availability, commuting costs and personal circumstances also need to be considered.
What Is London Living Rent?
London Living Rent is a form of affordable housing intended to help eligible Londoners save towards buying a home.
City Hall states that the average monthly rent for a two-bedroom London Living Rent home being let in 2026-27 is around £1,409. That was calculated as just under two-thirds of the average market rent used by City Hall when the figure was set.
Actual London Living Rent amounts differ according to location.
The scheme should not be confused with the London Living Wage. London Living Rent relates to affordable housing, while the London Living Wage is a voluntary wage rate calculated separately.
Are London Energy Bills Rising in 2026?
Energy has become another significant contributor to household costs.
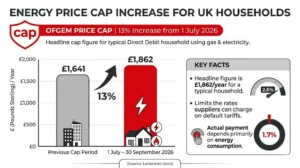
Ofgem’s energy price cap increased by 13% from 1 July 2026.
For the period from 1 July to 30 September 2026, the headline price-cap figure is £1,862 per year for a typical household using electricity and gas and paying by Direct Debit.
That compares with £1,641 during the previous cap period.
The cap does not mean every household pays £1,862.
It limits the rates suppliers can charge customers on relevant default tariffs. The actual amount paid still depends primarily on household energy consumption.
From July 2026, Ofgem’s average Direct Debit rates are:
| Energy | Unit rate | Daily standing charge |
| Electricity | 26.11p per kWh | 57.19p |
| Gas | 7.33p per kWh | 29.04p |
The rates include VAT, while exact regional charges can vary.
How Many Londoners Are in Fuel Poverty?
City Hall reported in July 2026 that around 10% of Londoners were living in fuel poverty.
A new £58.7 million Home Energy Saving Fund has consequently been announced using government funding.
The programme is expected to support energy-efficiency improvements in up to 5,000 of London’s less energy-efficient social homes.
City Hall estimates qualifying households receiving improvements could save as much as £500 per year on energy bills, depending on the property and work carried out.
Is Food Getting More Expensive?
Food inflation has eased considerably compared with the highest levels seen during the earlier cost-of-living crisis.
The latest ONS consumer price inflation figures show food and non-alcoholic beverage prices increased by 1.7% in the year to June 2026.
That was down from 2.2% in May and represented the lowest annual food inflation rate since August 2024.
Food prices actually fell by 0.2% between May and June 2026.
But falling food inflation should not be interpreted as food becoming as cheap as it was several years ago.
Inflation measures the rate at which prices change.
If an item increased sharply in price during previous years and subsequently rises more slowly, consumers still pay the higher underlying price.
This explains why households can continue to feel financial pressure even when official inflation statistics improve.
Are Everyday Prices Higher in London Than Elsewhere?
In many cases, yes, although the size of the London premium varies significantly by product.
GLA Economics compared locally collected prices for 68 comparable products and services.
Its analysis found London prices were higher than the wider UK figure for 55 of the 68 items examined.
The differences are particularly apparent among services where local labour and commercial property expenses influence prices.
The analysis suggested this is one reason London households may experience the cost-of-living environment differently from households elsewhere, even when both are exposed to the same national inflation rate.
How Much Does Transport Cost in London?
Transport costs vary considerably depending on where someone lives, where they work and how often they travel.
For bus and tram passengers, Transport for London has temporarily protected one of the capital’s most widely used fares.
A single adult bus or tram journey remains £1.75 until 1 November 2026.
The Hopper fare allows passengers using the same payment method to make unlimited bus and tram journeys within one hour for the same £1.75 fare.
The £1.75 fare has been unchanged since March 2023.
However, TfL says the single fare is expected to increase by 10p to £1.85 from 1 November 2026, while the daily bus and tram cap is expected to rise from £5.25 to £5.55.
Tube and rail fares are calculated separately and depend on zones, time of travel and the specific journey.
How Expensive Is Childcare in London?
Childcare can become one of the largest expenses after housing for families with young children.
The London Datastore’s latest childcare series includes data through 2025 and demonstrates a large difference between households that qualify for government-funded childcare and those that do not.
For eligible working parents, average part-time childcare costs covering 25 hours per week fell from £192 in 2024 to £84 in 2025 after expanded childcare entitlements were introduced.
For families not eligible for the free childcare entitlement, the corresponding average increased from £192 to £210 per week.
The government-funded entitlement has since expanded to 30 hours for eligible working parents of children from nine months to four years.
Eligibility conditions apply, so parents should check the government’s current childcare rules rather than assuming that all nursery hours are automatically free.
Is Inflation Falling in the UK?
Yes, according to the latest available official figures, although prices overall are still rising.
UK CPI inflation was 2.6% in June 2026, down from 2.8% in May.
The broader CPIH measure, which includes owner-occupiers’ housing costs, stood at 2.8%.
Several categories were still increasing more quickly than headline inflation.
For example:
| Category | Annual inflation, June 2026 |
| Overall CPI | 2.6% |
| Food and non-alcoholic drinks | 1.7% |
| Housing and household services | 2.7% |
| Transport | 5.7% |
| Communication | 5.2% |
| Restaurants and hotels | 4.4% |
| Services overall | 3.6% |
These differences matter because every household has a different spending pattern.
Someone spending a large proportion of their income on rent, commuting and childcare can therefore experience considerably more financial pressure than the headline inflation figure might suggest.
What Cost of Living Support Is Available in London?
There is no general Cost of Living Payment for 2026, according to the government’s current cost-of-living guidance.
However, other forms of assistance remain available.
Crisis and Resilience Fund
The Household Support Fund has been replaced by the Crisis and Resilience Fund in England.
According to GOV.UK cost-of-living guidance, local councils may use the fund to help eligible households with costs including:
- food;
- energy bills;
- water bills;
- essential household items; and
- some housing costs.
People do not necessarily need to receive benefits to qualify.
Each London borough decides how its local scheme operates, meaning eligibility criteria and application procedures can differ between councils.
Council Tax Support
People on low incomes or certain benefits may also qualify for Council Tax Reduction.
The level of support can depend on the borough, household circumstances, income and other eligibility rules.
Energy Support
The government states that measures introduced from April 2026 remove an average £150 from household energy costs, with the reduction applied automatically rather than through a separate household application.
Other support can include social tariffs for eligible broadband and telephone customers and assistance with water bills.
How Can Londoners Reduce Their Cost of Living?

There is no single strategy that works for every household, particularly when rent represents the majority of spending.
However, households can review several areas.
Check Benefits and Local Support
- People whose circumstances or income have changed may be entitled to assistance they have not previously claimed.
- Government and council eligibility calculators can therefore be useful before assuming no support is available.
Review Transport Spending
- Using buses rather than more expensive routes where practical, making use of TfL fare caps and checking eligibility for concessionary Oyster schemes may reduce commuting expenses.
Check Energy Tariffs and Consumption
- The Ofgem price cap should not be interpreted as a target bill.
- Households using less energy generally pay less, while customers can also compare available fixed and variable tariffs.
Compare Housing Costs Carefully
- Moving further from central London may reduce rent, but households should consider whether additional transport costs would offset the saving.
- A lower monthly rent is not automatically cheaper overall if it substantially increases commuting expenditure.
Check Childcare Entitlements
- Families with young children should check whether they qualify for government-funded childcare or Tax-Free Childcare, as eligibility can significantly change the real cost of nursery provision.
Why Falling Inflation Does Not Mean London Is Cheap Again?
One of the biggest misconceptions surrounding the cost-of-living debate is that falling inflation means prices are falling.
Usually, it does not.
If inflation falls from 10% to 3%, prices are generally still increasing; they are simply increasing more slowly.
This distinction matters particularly in London because cumulative price increases have already been substantial.
GLA Economics estimates London’s shelf-front prices have risen by roughly 70% since 2008, compared with around 61% across the UK.
Housing costs sit on top of that difference.
The average London private rent of £2,302 is around 59% higher than the £1,446 England average. That comparison is calculated from the latest ONS figures.
As a result, even modest inflation can continue to strain household finances when essential expenses already start from unusually high levels.
Is London Becoming More Affordable?
There are some encouraging signs.
Rental inflation in London has slowed significantly and is currently lower than in every other English region. Food inflation has also eased, while the overall UK CPI rate has fallen to 2.6%.
Some public transport fares remain frozen temporarily, while new government and City Hall programmes are targeting energy costs and financially vulnerable households.
However, affordability is about the level of prices relative to incomes, not inflation alone.
London remains England’s most expensive region for private renting, while locally priced services can carry substantial premiums compared with the national average.
That means affordability is unlikely to improve dramatically simply because inflation is slowing.
What Does the Cost of Living Outlook Mean for Londoners?
The cost-of-living picture in London in 2026 is mixed.
Headline inflation is moderating and rental increases have slowed, but households are dealing with prices that have already risen substantially over several years.
Housing remains the clearest pressure. An average private rent of £2,302 per month means London renters are spending far more than tenants elsewhere in England before food, energy, transport, childcare and other essentials are considered.
Energy costs have also risen again during the summer, while services such as childcare, hospitality and other locally priced activities continue to reflect London’s higher operating costs.
The most important distinction is therefore between inflation slowing and living costs falling.
The former is happening. The latter is much less clear.
For London households, meaningful improvements in affordability will depend not simply on lower inflation but on the relationship between income growth and the cost of housing, energy, transport, childcare and everyday essentials.
Cost of Living in London: Frequently Asked Questions
What is the average rent in London in 2026?
The average private rent in London was £2,302 per month in June 2026, according to the Office for National Statistics.
Is London more expensive than the rest of the UK?
London is significantly more expensive for some major expenses, particularly private housing and locally provided services. GLA Economics found London shelf-front prices had risen around 70% since 2008, compared with roughly 61% across the UK.
What is the current inflation rate?
UK CPI inflation was 2.6% in June 2026, while CPIH inflation was 2.8%.
How much is a London bus fare?
An adult pay-as-you-go bus or tram fare is currently £1.75, with the freeze running until 1 November 2026. TfL expects the fare to rise to £1.85 after that date.
How much is the energy price cap?
Ofgem’s price cap for a typical dual-fuel Direct Debit household is £1,862 a year from 1 July to 30 September 2026. Actual bills depend on energy consumption.
Is there a Cost of Living Payment in 2026?
No. GOV.UK states that there will be no Cost of Living Payment for 2026 and no further payments are currently planned. Other benefits, council support and the Crisis and Resilience Fund remain available depending on eligibility.
About the Journalist
Jermaines covers crime, legal affairs and money-related stories for Londoner. His reporting includes police updates, court cases, consumer rights, personal finance and cost-of-living issues. He handles sensitive subjects carefully and clearly distinguishes confirmed facts from allegations, estimates and ongoing investigations.